Coffee Sales Analytics EXCEL
Transformed NYC coffee sales data into interactive dashboards. Optimized reporting from hours to minutes and highlighted peak sales hours & top products.
Excel
Power Query
Pivot Tables
Charts

From 3 Hours to 20 Minutes with Smart Data Solutions
Excel • SQL • Python • Power BI • AWS • Microsoft Fabric • Linux • Google Sheets
Transformed NYC coffee sales data into interactive dashboards. Optimized reporting from hours to minutes and highlighted peak sales hours & top products.
Excel
Power Query
Pivot Tables
Charts

Analyzed one year of pizza sales data to uncover customer behavior, peak hours, and revenue trends. Transformed raw data using Power Query and built dashboards to highlight top-selling products and seasonal performance.
Excel
Power Query
Pivot Tables
Charts

Analyzed hospital patient data (2011–2022) to uncover trends in admissions, readmissions, length of stay, and costs. Queried and aggregated data using SQL to generate insights for healthcare operations and decision-making.
sql
Joins
Aggregation
Data Exploration

This project analyzes mock National Rail train ticket data in the UK from Jan–Apr 2024. The dataset includes ticket types, travel dates & times, departure & arrival stations, prices, and journey status.
Power Bi
Power Query
Dax
Visuals
Cleaned and prepared the NYC 2020 Accident dataset for analysis. The dataset contains information about vehicle types, contributing factors, locations, and casualties. Used Python, Pandas, and Numpy for data cleaning.
Python
Jupyter Notebook
Pandas
Numpy

Ingested raw data into S3, ran analysis with Athena, and stored processed results back in S3 for easy access and reporting
S3 Bucket
Aws Athena
Data Ingestion
Aws Crawler
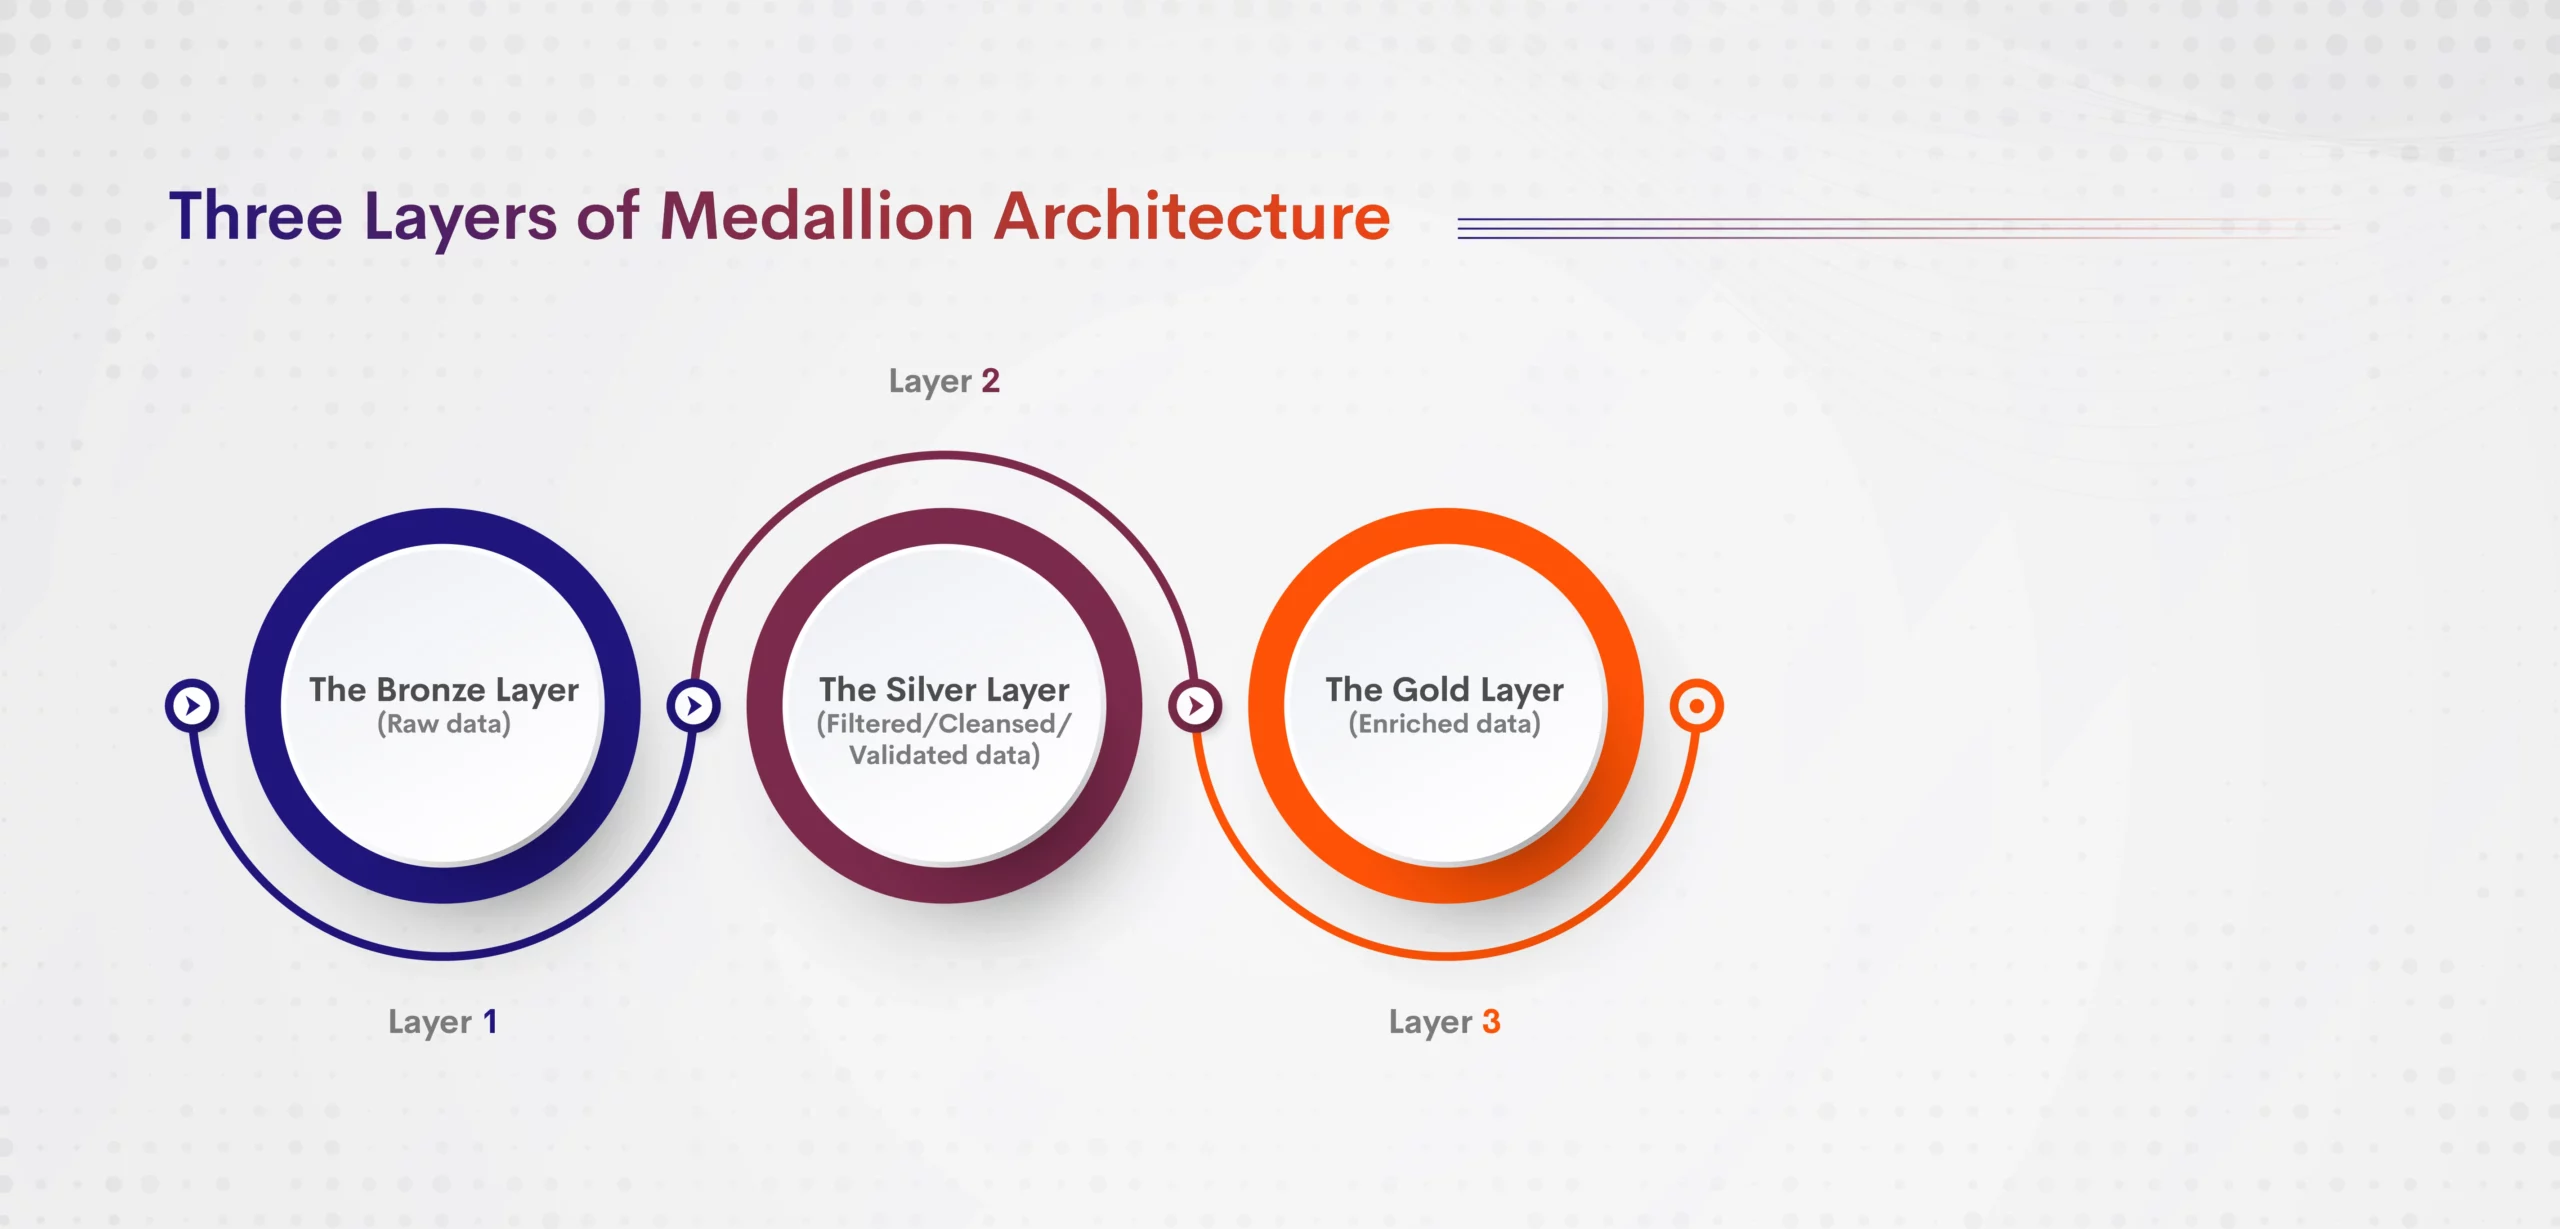
Built an end-to-end data pipeline using Microsoft Fabric, transforming raw data into structured insights through Lakehouse, Data Warehouse, and Semantic Model layers for reporting and analytics.
Microsoft Fabric
Medallion Architecture
Lake House
Sementic Model

End-to-end analysis of NYC motor vehicle accidents using Microsoft Fabric and Power BI. This project demonstrates data ingestion, transformation, semantic modeling, and interactive dashboards to uncover accident trends and insights..
Microsoft Fabric
Medallion Architecture
Lake House
Sementic Model